Conversion rate
18.43%
(+0.1%) vs previous month
Conversion rate
18.43%
Renewal rate
62.92%
Trials this month
2,094
Conversions this month
377
February was a partial ramp-up month and is shown for context only.
Bars show absolute monthly volume; dotted lines track the monthly conversion and renewal rates.

| Month | Trials | Conversions | Renewals | Purchases | Conv rate | Renew rate |
|---|---|---|---|---|---|---|
| February 2026 | 1,293 | 4 | 0 | 1 | — | — |
| March 2026 | 2,046 | 238 | 2 | 0 | 18.41% | 40.00% |
| April 2026 | 2,094 | 377 | 151 | 0 | 18.43% | 62.92% |
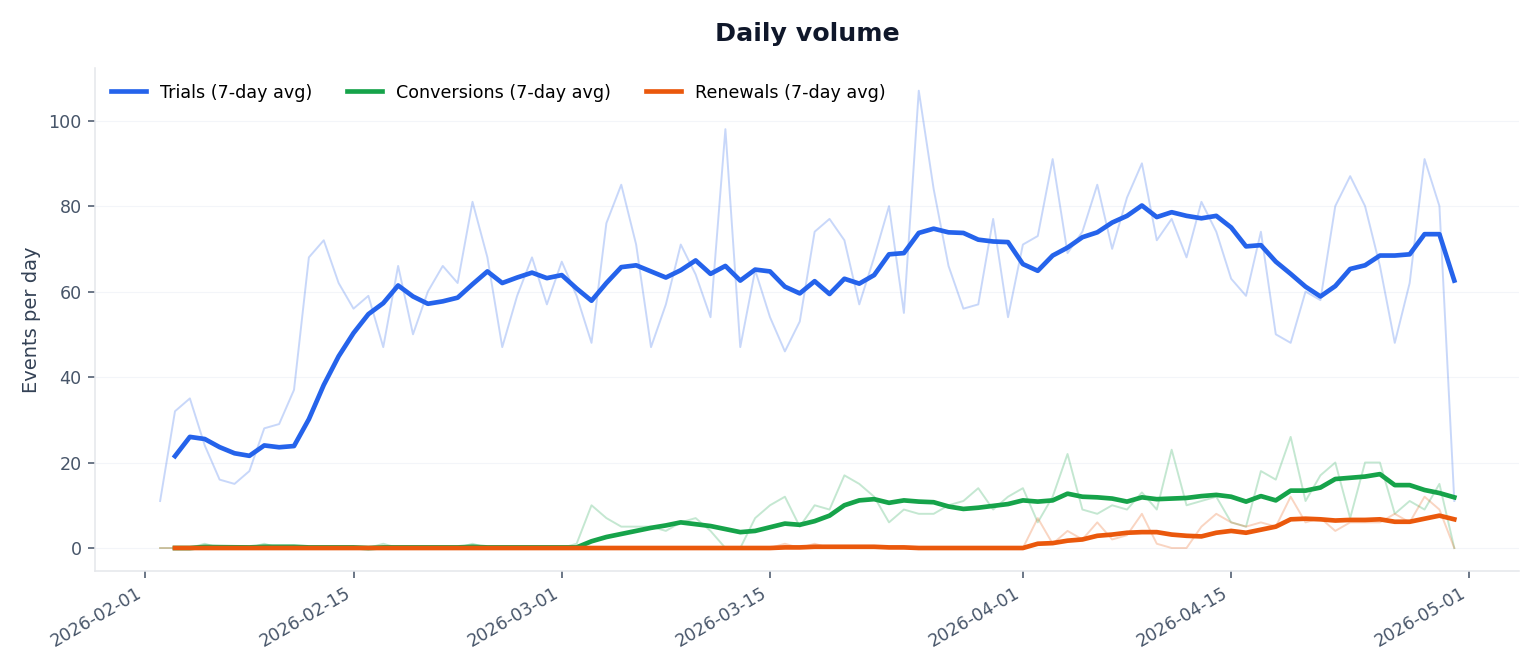
Daily values with 7-day rolling averages and a linear trend line for direction.
Faded lines show raw daily counts; bold lines are 7-day rolling averages.
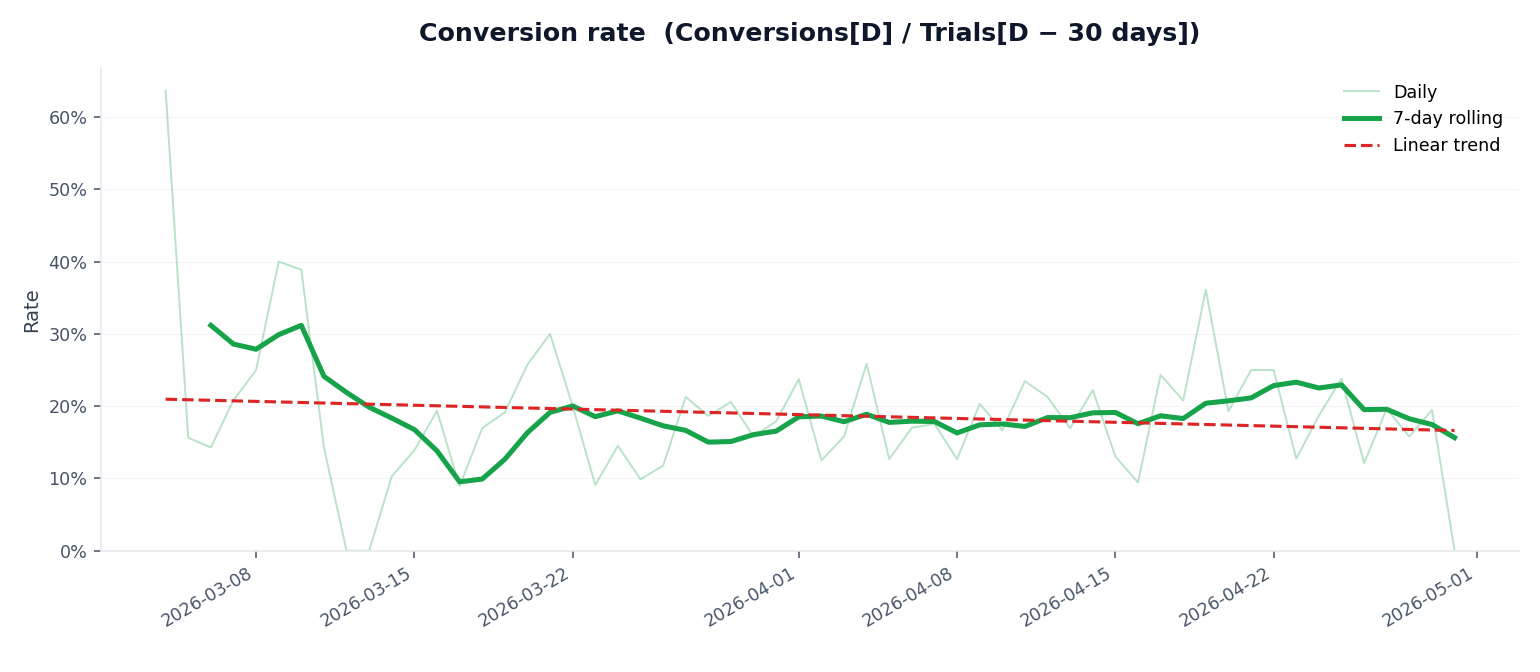
Share of trials that converted to a paying customer 30 days later.
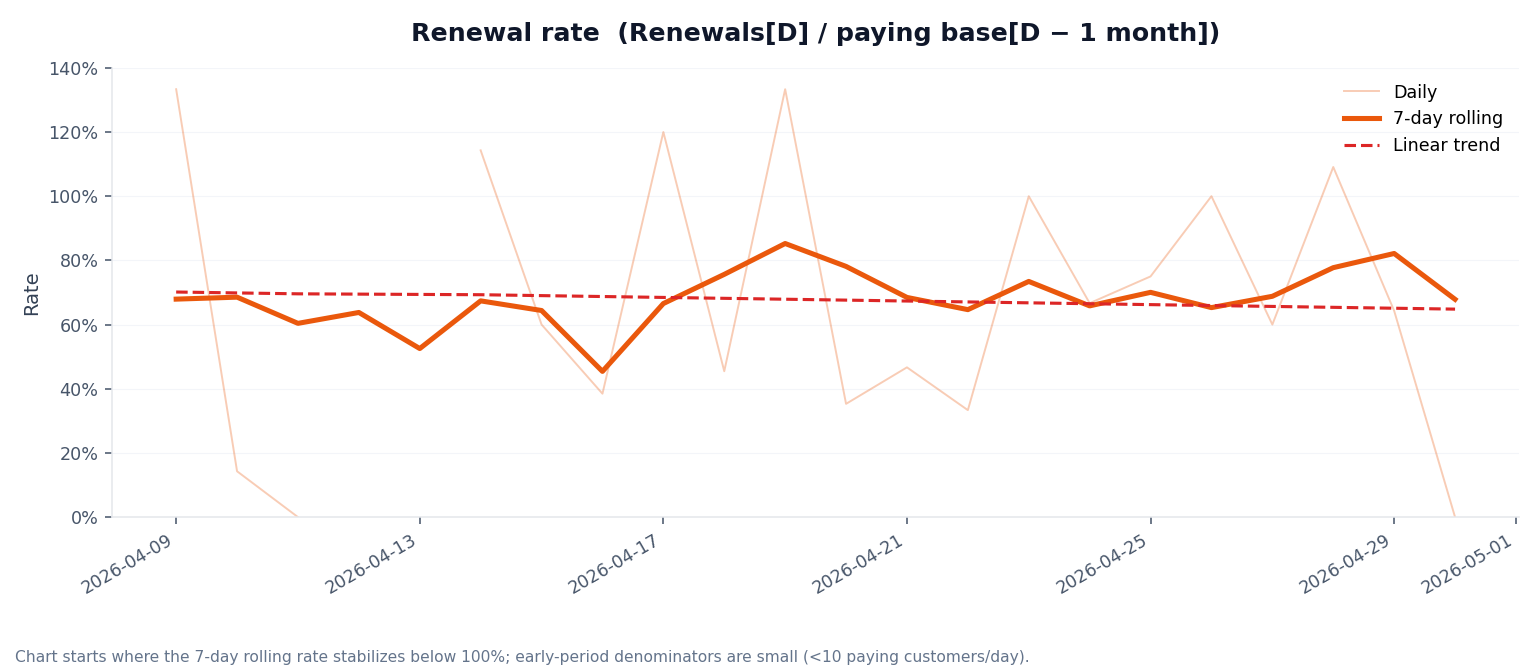
Share of paying customers from one month earlier who renewed on the given day. Early days with no eligible base are omitted from the chart; full daily values remain in metrics.csv.
Cohort view by week the trial started. Tracks publish-through rate and unit economics — cost per created vs published website, and the share of sites whose AI cost exceeds $7.
| Zoom Date | Websites Created | Websites Published | Publish Rate | Cost per Created Website | Cost per Published Website | Count of websites with total cost > $7 | Websites Cost > $7 Share |
|---|---|---|---|---|---|---|---|
| 27 Apr 2026 | 136 | 23 | 16.9% | $0.45 | $2.65 | 0 | 0.0% |
| 20 Apr 2026 | 245 | 103 | 42.0% | $1.37 | $3.26 | 4 | 1.6% |
| 13 Apr 2026 | 249 | 104 | 41.8% | $1.78 | $4.26 | 11 | 4.4% |
| 6 Apr 2026 | 285 | 144 | 50.5% | $1.60 | $3.16 | 8 | 2.8% |
| 30 Mar 2026 | 259 | 173 | 66.8% | $1.93 | $2.89 | 8 | 3.1% |
| 23 Mar 2026 | 287 | 162 | 56.4% | $2.17 | $3.84 | 12 | 4.2% |
| 16 Mar 2026 | 259 | 152 | 58.7% | $1.82 | $3.10 | 10 | 3.9% |
| 9 Mar 2026 | 258 | 119 | 46.1% | $1.51 | $3.27 | 7 | 2.7% |
| 2 Mar 2026 | 221 | 107 | 48.4% | $1.41 | $2.91 | 4 | 1.8% |
| 23 Feb 2026 | 263 | 132 | 50.2% | $1.19 | $2.37 | 3 | 1.1% |
| 16 Feb 2026 | 230 | 106 | 46.1% | $1.44 | $3.13 | 5 | 2.2% |
| 9 Feb 2026 | 212 | 64 | 30.2% | $1.22 | $4.03 | 4 | 1.9% |
| 2 Feb 2026 | 68 | 0 | 0.0% | $1.12 | 0 | 0.0% |
Note: 27 Apr 2026 is a partial week.
Per-website AI action counts over the trailing 30 days. Includes test users — treat the absolute floor with caution; the shape of the tail is the signal.
Sites with >300 AI actions (30d)
33
of total active sites
Max actions on a single site
2,336
top of the tail
Distribution across all websites with at least one action.
| Percentile | Actions per site |
|---|---|
| p50 | 21 |
| p75 | 31 |
| p90 | 78 |
| p95 | 130 |
| p99 | 340 |
Per-website counts in the trailing 30 days, split by action category.
| Action type | p50 | p75 | p90 | p95 | p99 |
|---|---|---|---|---|---|
| Generate website section markup | 7 | 8 | 10 | 11 | 18 |
| Edit website section markup | 8 | 18 | 60 | 108 | 308 |
| Image generation | 2 | 3 | 6 | 11 | 30 |
| Logo generation | 2 | 2 | 2 | 2 | 6 |
| Favicon generation | 2 | 2 | 4 | 6 | 14 |